Capable
UI/UX design at Bitsens for CAPABLE, an EU Horizon 2020 project building a coaching system for cancer patients at home. Designed both parts alone: a web dashboard for oncologists and an Android app for patients.
Reviewed by the consortium every week
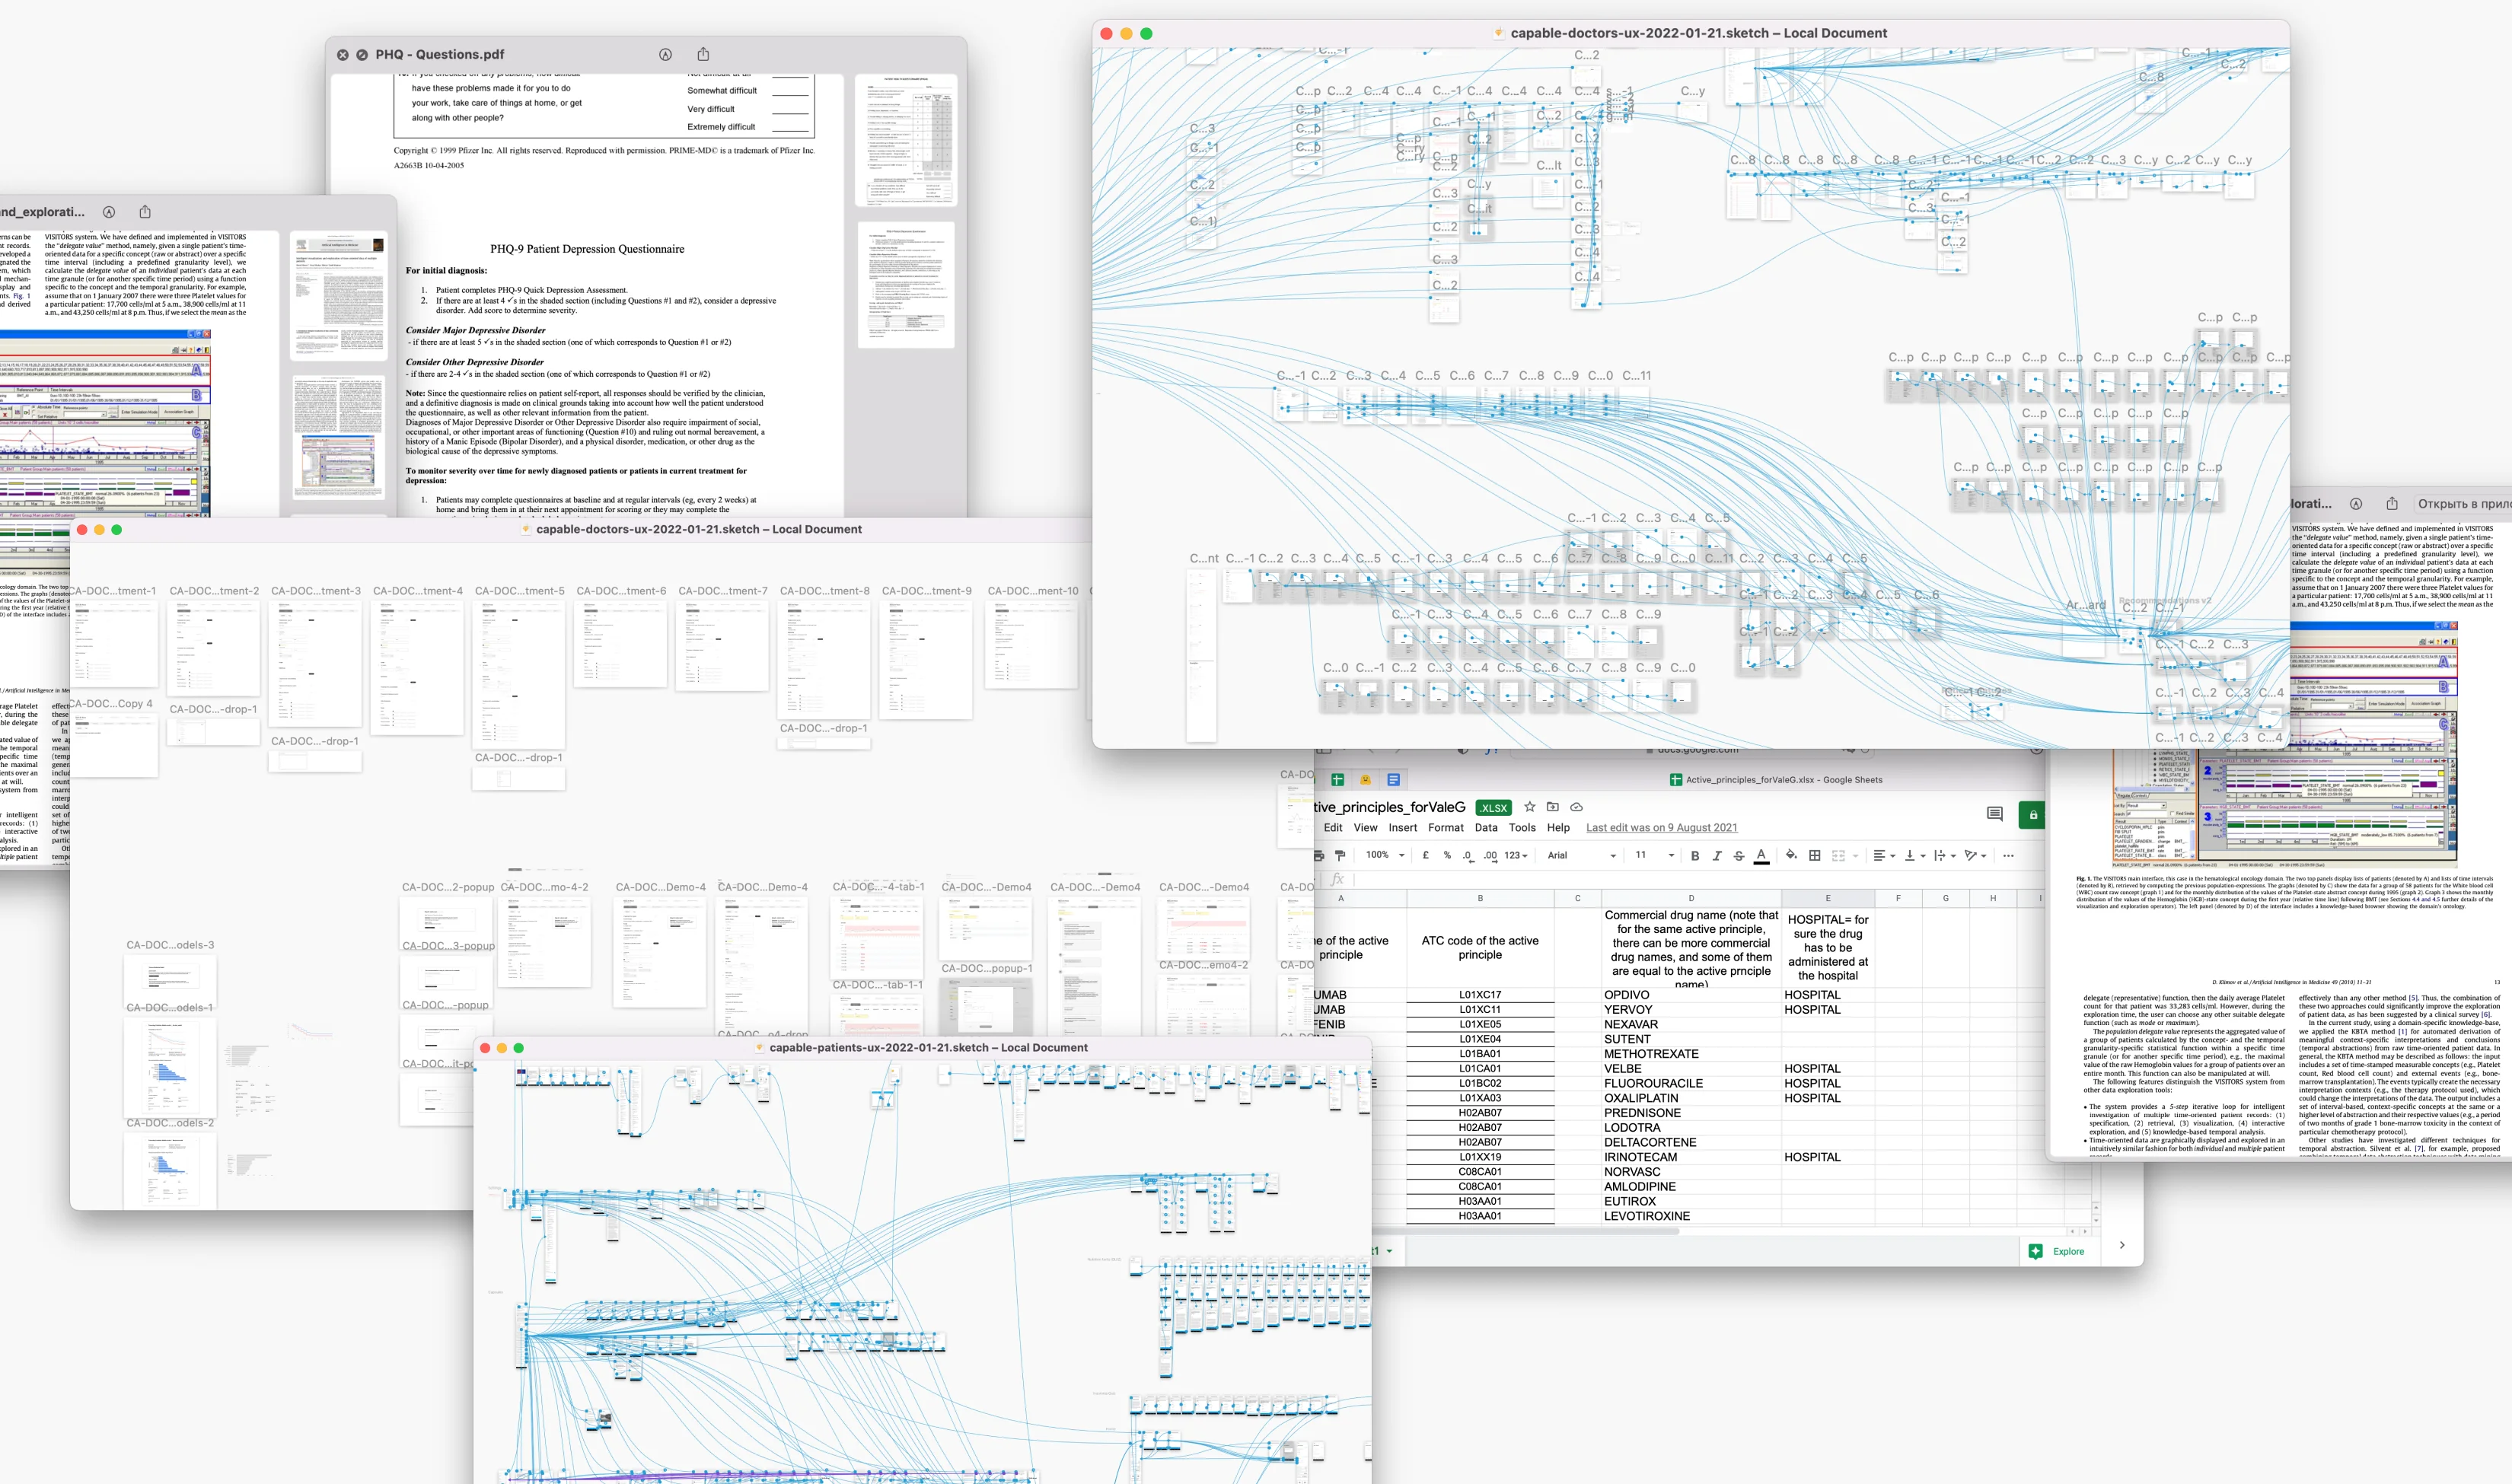
A year and a half on one product, most of it on UX. Every week the art director presented the work to the consortium: doctors, researchers and professors from the partners below. Their comments came back as a list of fixes, done before the next meeting.





Doctors and psychologists defined every feature; the job was to turn them into screens. Started from a draft of patient enrollment, one concept screen and a dashboard sketch, plus a small concept for the app. A manager and the art director were on the team from the start; frontend and backend developers joined later, then Android.
A patient card and its charts
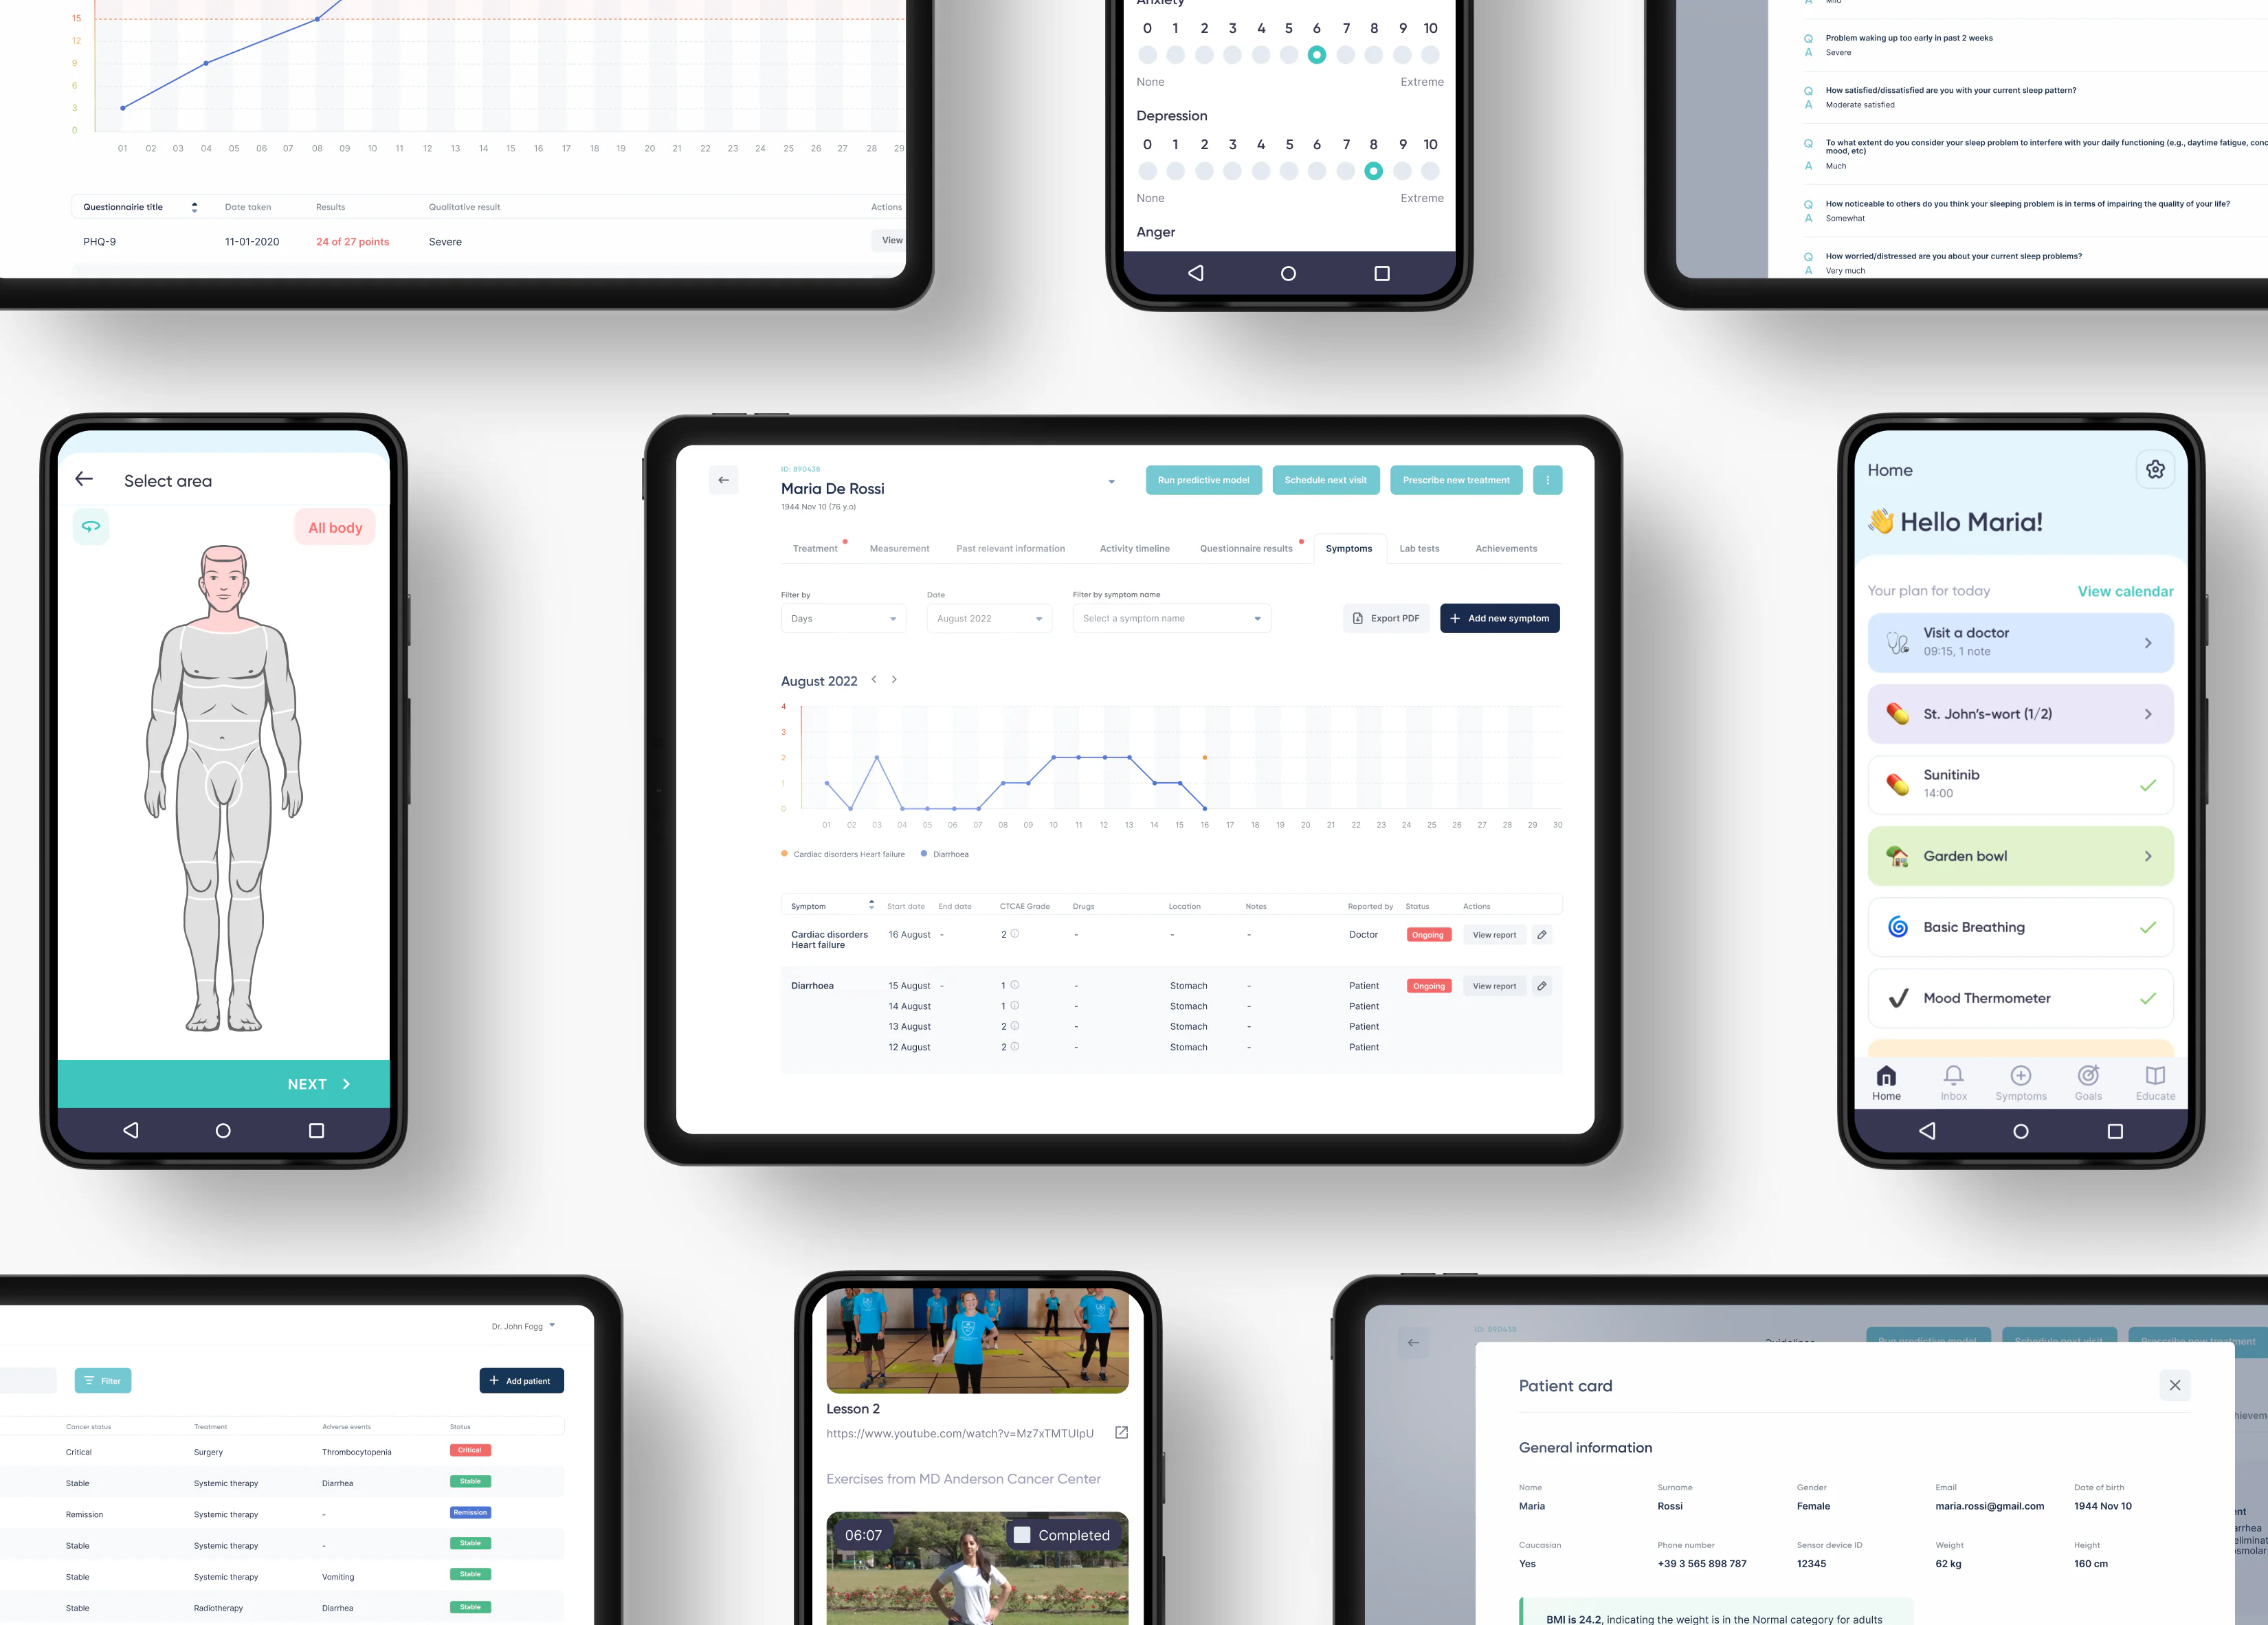
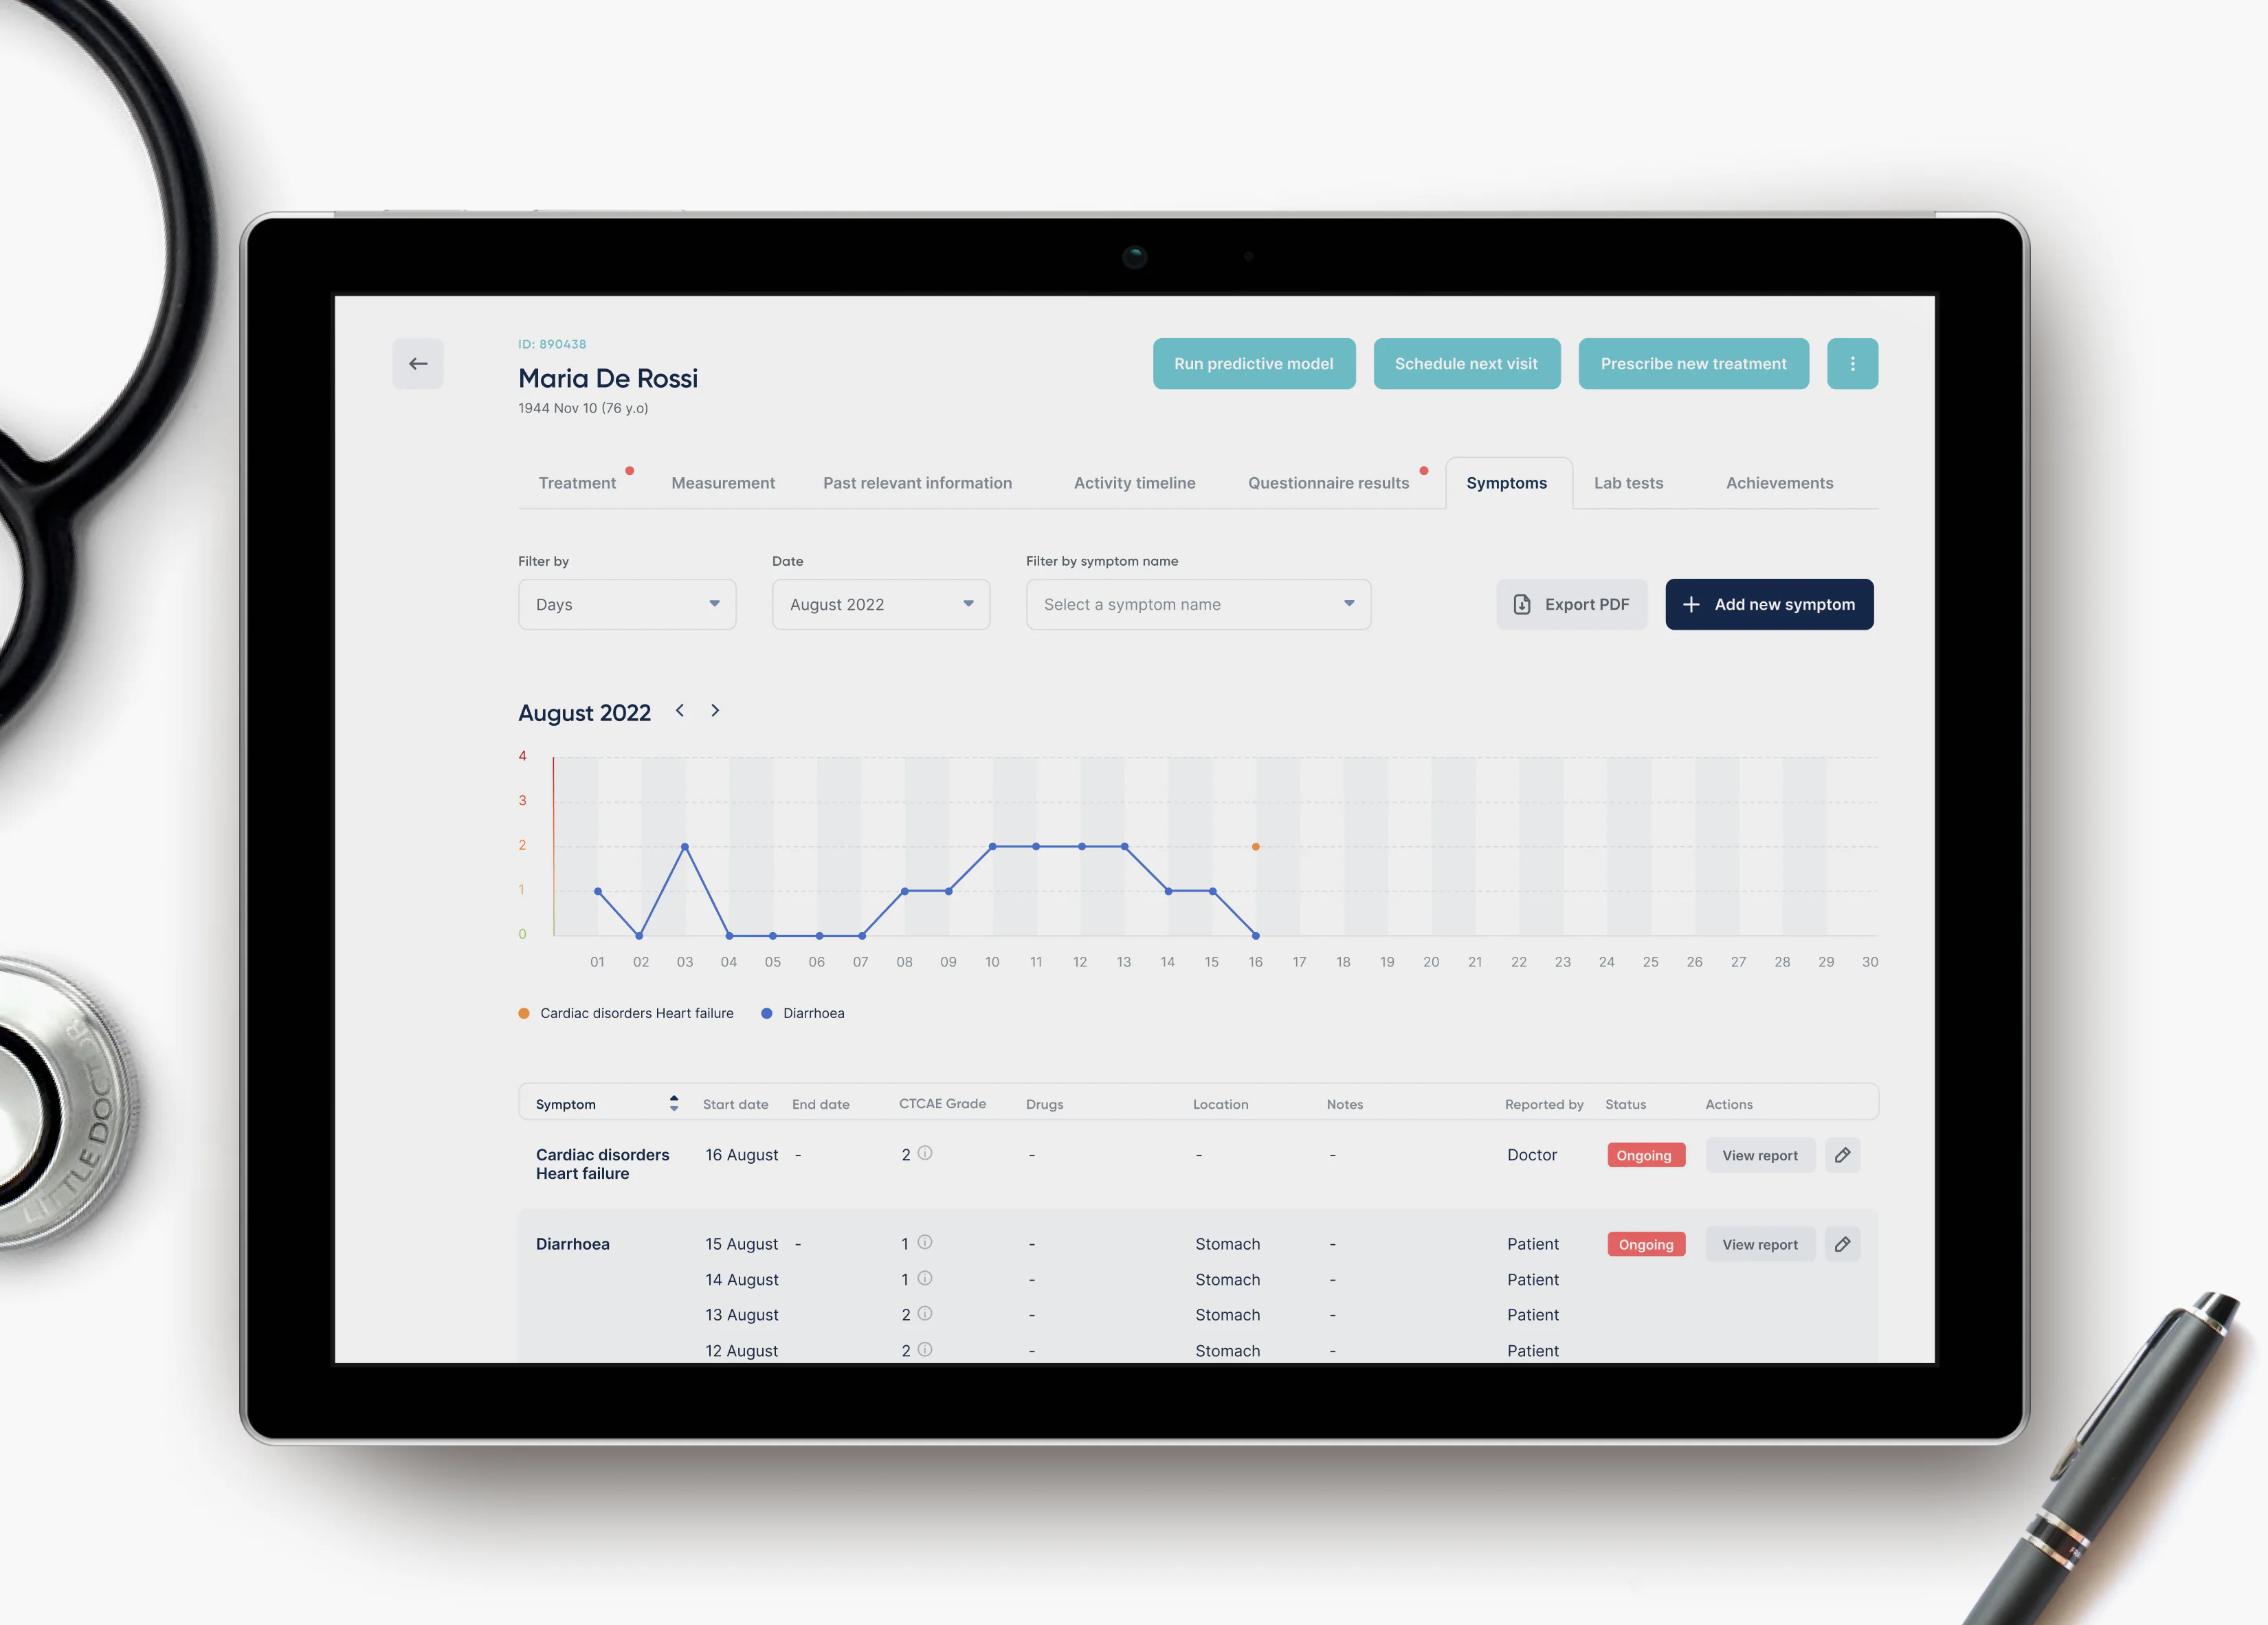
The dashboard rests on three things: the patient list, enrolling a patient and the patient card. The list shows every patient in the system with their status. Reworked the inherited enrollment draft into the full flow. The card holds one patient in eight tabs: treatment, measurements, past history, activity timeline, questionnaire results, symptoms, lab tests and achievements.
AI advice next to the prescription
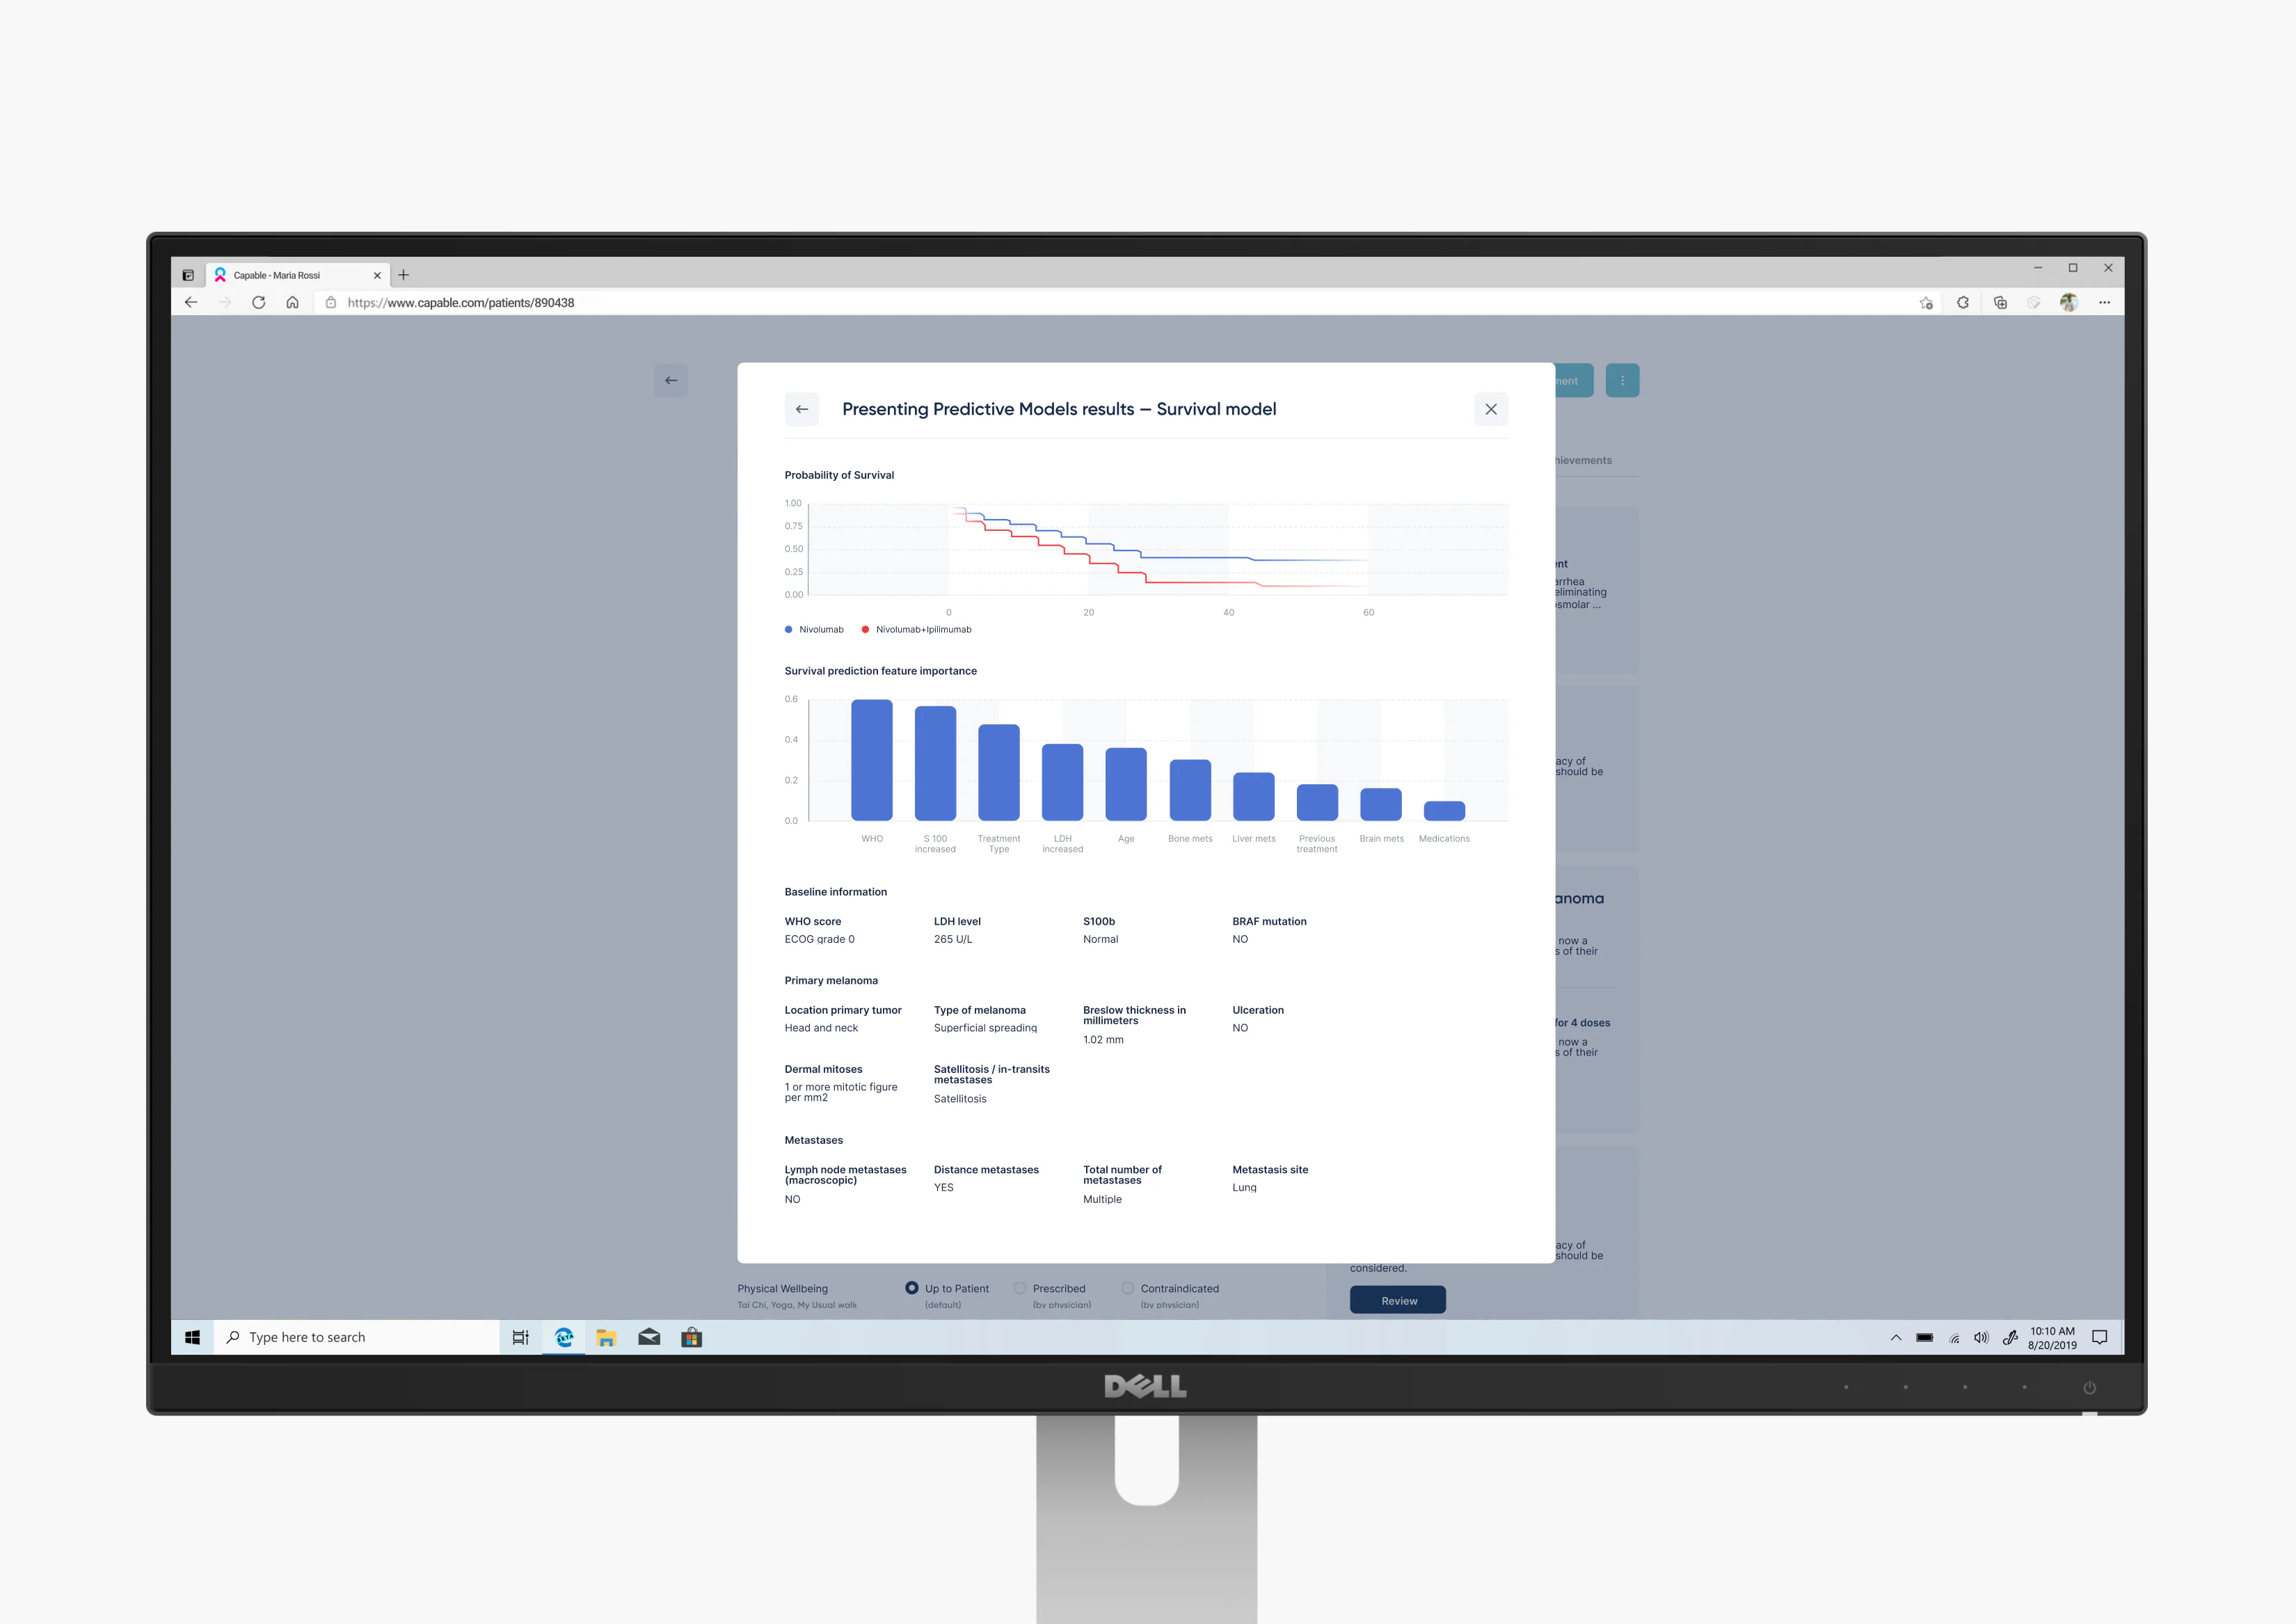
A side panel in the card suggests treatment from clinical guidelines. Before prescribing, the doctor can also run a survival model that IBM built on data from other patients.
Designed the window for its results, so the doctor sees at a glance how a treatment is likely to go for this patient, based on how it went for others.
Symptoms from home
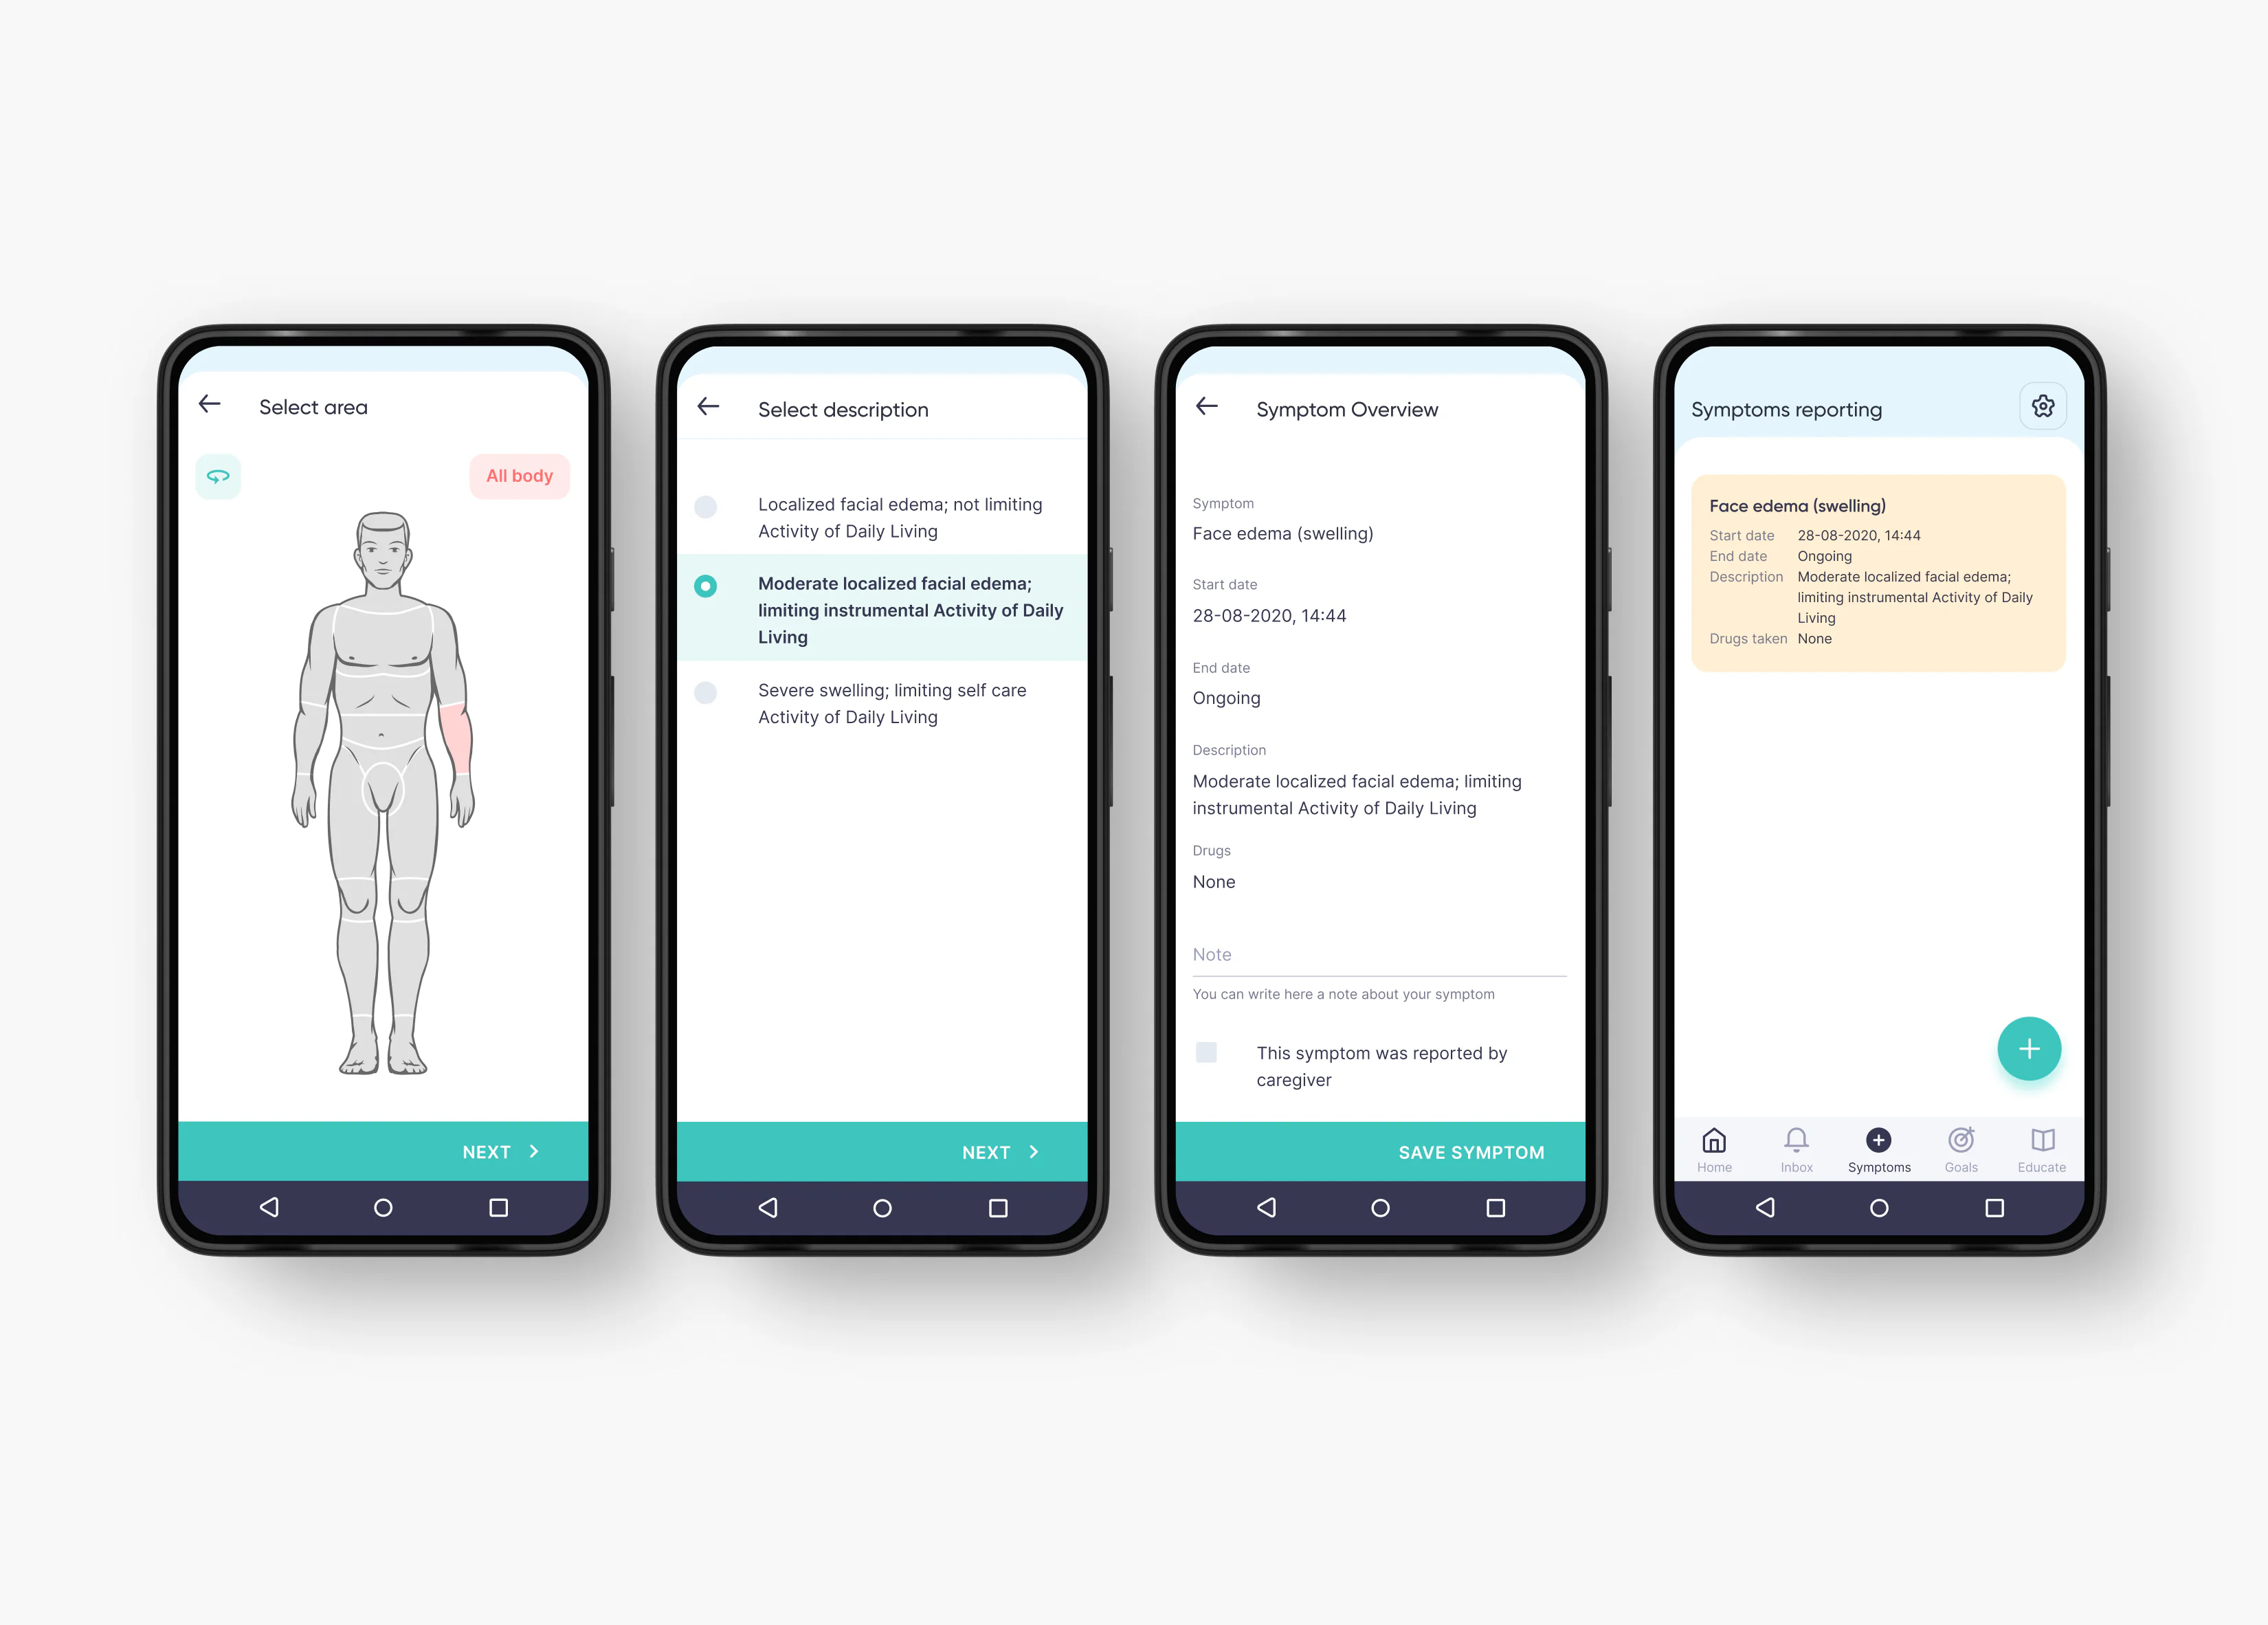
The patient reports a symptom on a body map, then picks its severity, described as its effect on daily life; the wording came from the consortium's doctors. The report lands in the doctor's symptoms tab as a CTCAE grade.
Exercises as prescriptions
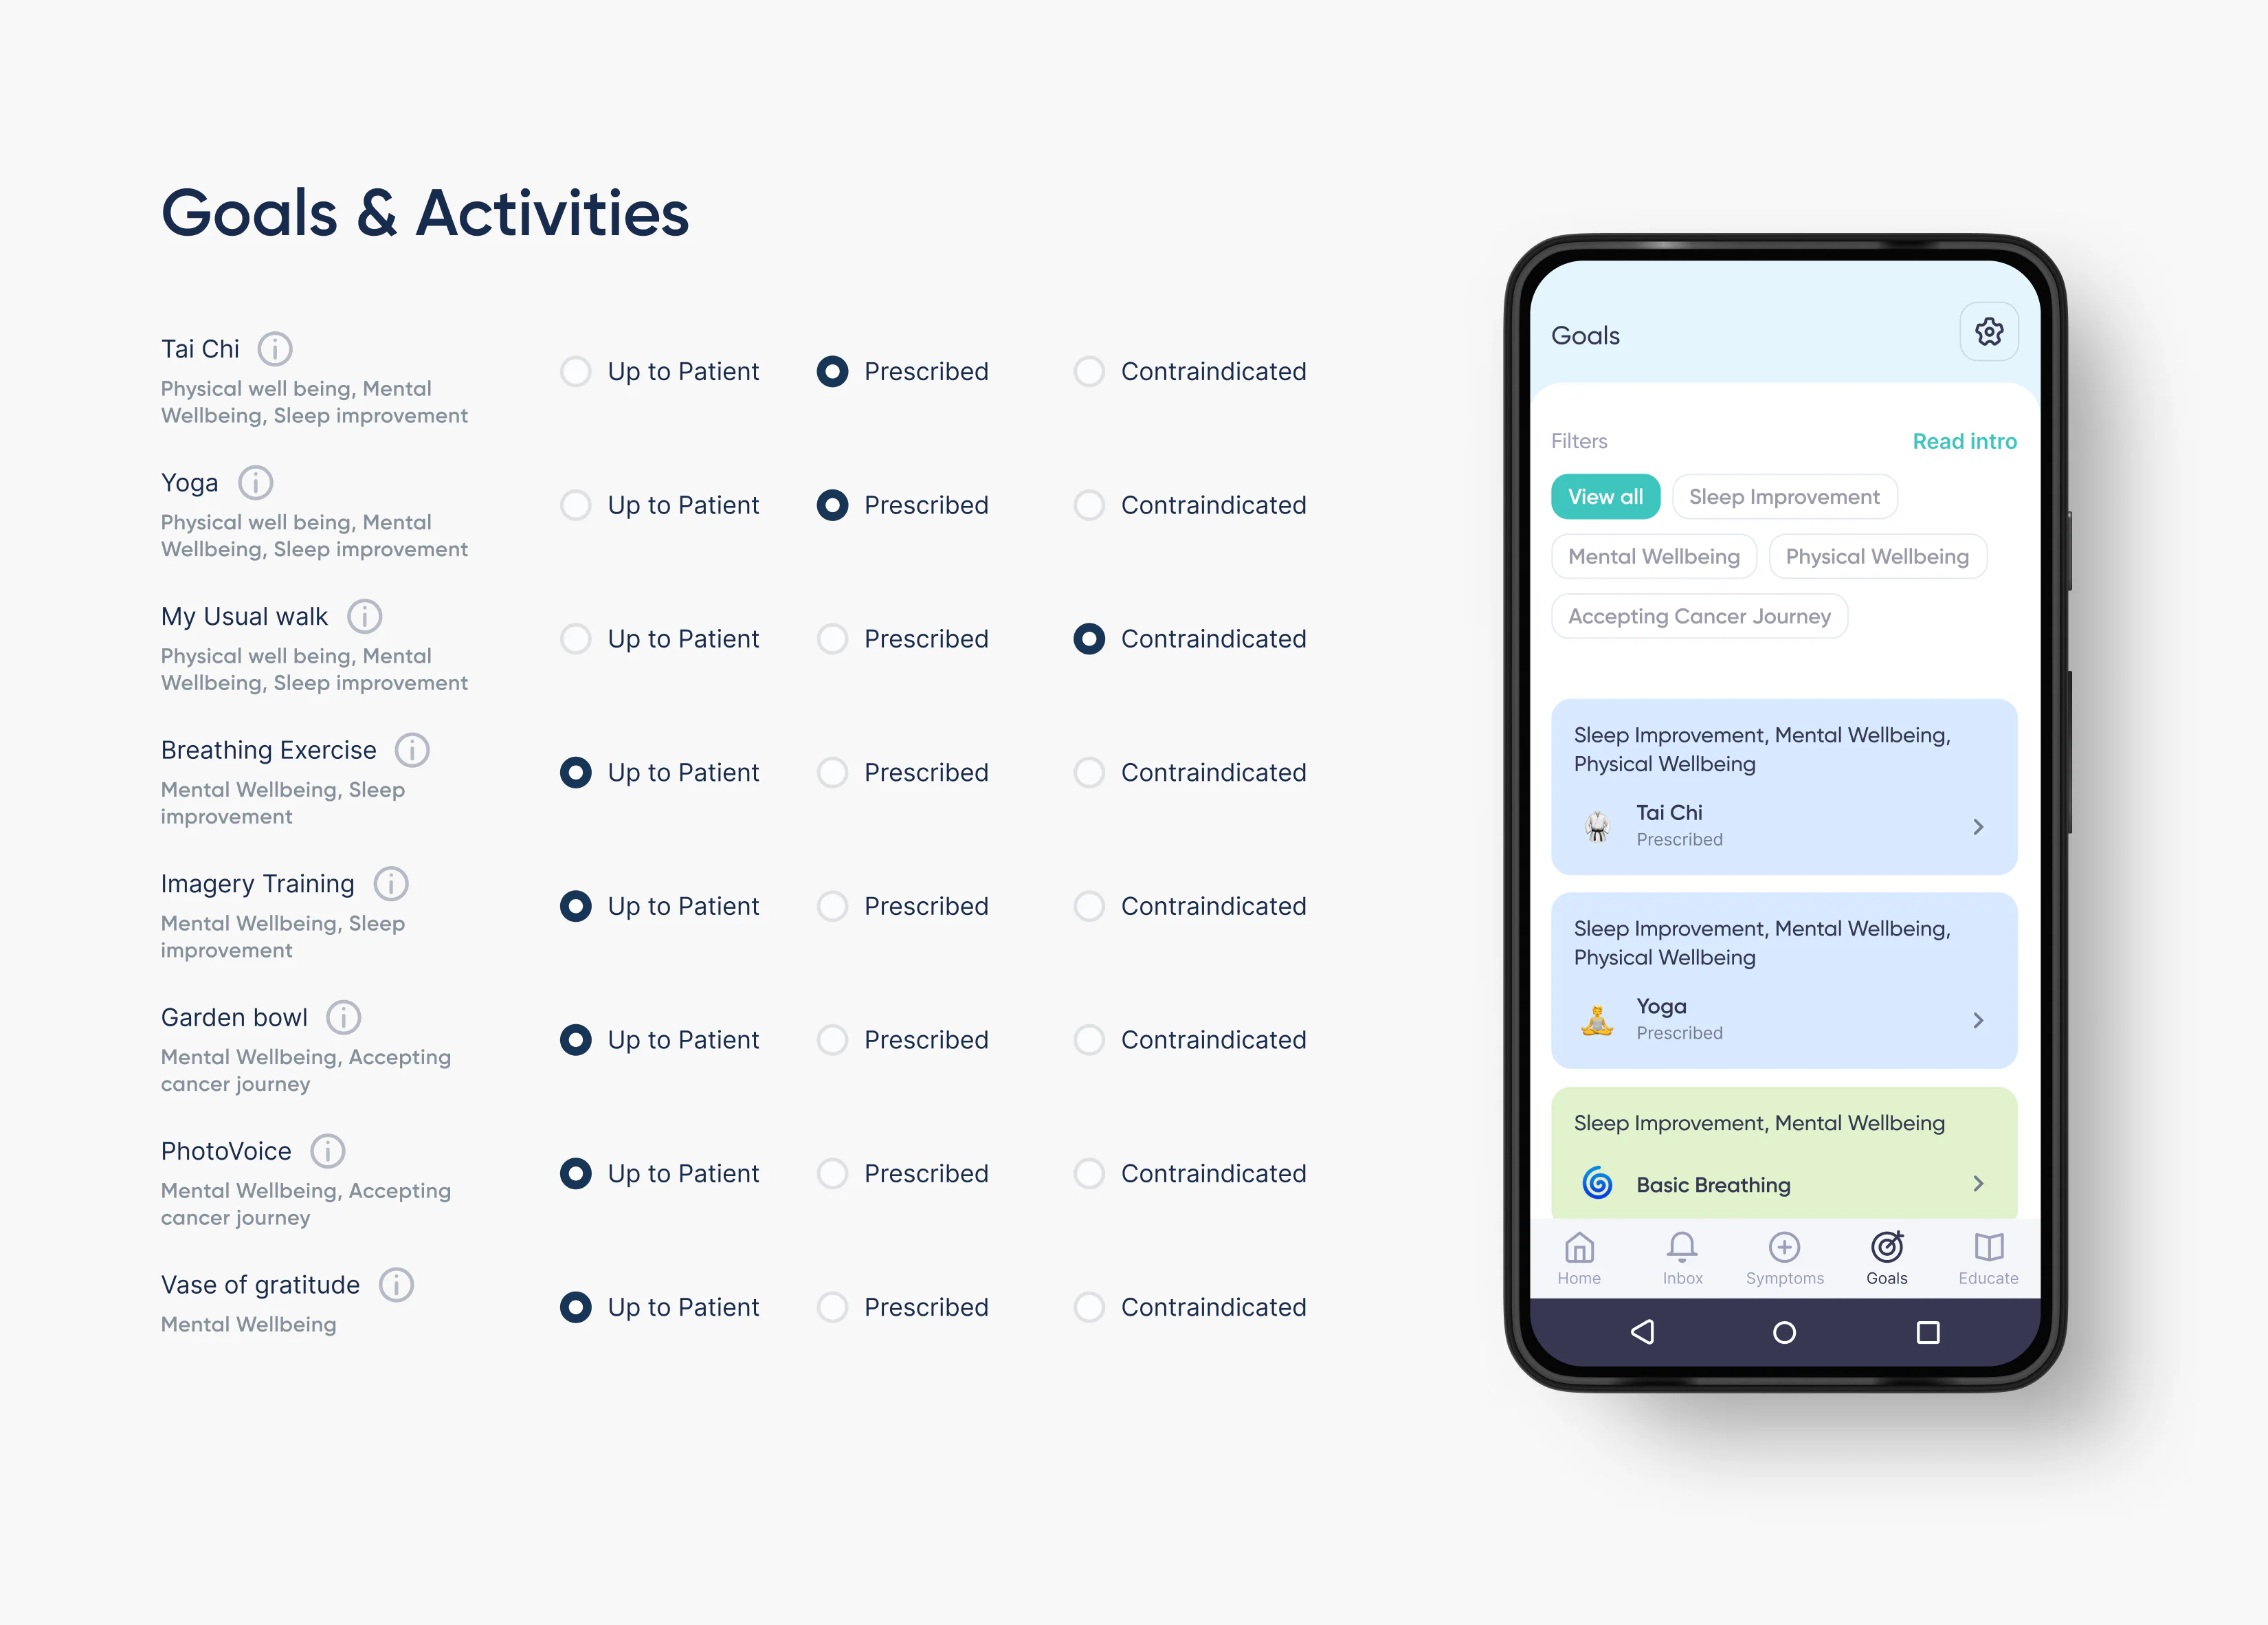
For each activity, from tai chi to the vase of gratitude, the doctor picks one of three: up to the patient, prescribed or contraindicated; the patient's goals show the prescribed ones first. Psychologists and doctors chose the set.
Handed over to development
Clinics ran interviews and usability tests on demos with patients. Development went on after the design was finished, and the rollout went ahead without the design team.